During the COVID-19 pandemic, the public was flooded with data from a variety of sources, some of them not reliable or reputable. Individuals began using ‘data’ to support their opinions about the pandemic and subsequent behaviors. This point in history brought into question whether adults are data literate. Can adults understand and make appropriate decisions based upon identified reliable data?
It was at this time that a pair of researchers in Israel probed whether and how adults use data to make decisions that can impact their everyday lives. Instead of using a vague definition of data literacy as being able to read, understand, and utilize data; the researchers broke it down into component parts examining each. The results were somewhat concerning but gives educators a starting point to help foster a data literate society.
What drives the public’s use of data?
In September 2020, Israel was beginning a second nationwide lockdown due to a new wave of COVID-19 infections. At this time, the researchers of the focus article surveyed 461 graduates of the Israeli state school system to determine how they use data in making decisions. Participants were given reliable data and asked to make decisions about travel, schools being open, and types of face coverings. Responses were coded as to what information was used as a reason for decisions, including whether or not the provided data was included.
Just over half of the participants referenced data in their reasoning for making decisions (Table 1). However, many used non-data sources of information like their own experiences and preferences, information from family and friends, and news sources. While data should not necessarily be the only piece of information used for complex decision-making, it is concerning that data was not even considered by almost half of adults.
Table 1: Percentage of adults who used data to justify their decisions for the following questions.

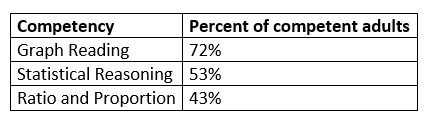
Perhaps adults did not use data because they lack competence with interpreting data presented in various forms. The researchers gave participants a 16-item survey to assess competency with reading graphs and tables, statistical reasoning, and ratio and proportion concepts. While most adults were competent with reading graphs (72%), fewer were able to reason statistically using averages and range, and less than half were competent with ratios and proportions. It is of note that there was variability in data interpretation competence among individuals that could be partly explained by education level.
Table 2: Percentage of adults who are competent in the following areas of data interpretation
Even though most adults could read graphs effectively on this measure, there were still gaps. Many participants focused on individual data points like outliers rather than read graphs holistically to glean information. This demonstrates a narrow view of how to interpret data representations, looking at the details rather than identifying and understanding the overall pattern of a graph.
Data at the intersection of science and math
According to the authors, "Data literacy is multi dimensional encompassing numerical, informational, graphical, statistical, computational, and digital literacies, as well as epistemic awareness, critical literacies, and discursive capabilities." (p. 1024). We can easily identify the mathematical components in this definition but there are others that do not clearly fall under other traditional school subjects.
As a well-educated former research scientist and assessment expert, I am data literate. I cannot recall a time when I specifically learned data literacy, instead it was likely repeated exposure and questioning about data during my many STEM classes that helped me develop this thinking skill. We should note that this article was published in the journal Science Education. The teaching of data literacy often falls under the purview of science, despite it being a complex concept.
To probe participants’ ideas about science, the authors surveyed participants’ trust in science. It is no surprise that adults that use data in their reasoning have a greater trust in science. It is also worth noting that, in general, the more educated the participant, the more trust they had in science and the more likely data was used as a reason. From the results of this study, the authors recommended increased and improved education in three areas: (1) trust in science, (2) ratio and proportional reasoning, (3) flexible ways of interpreting data representations. We will focus on the latter two recommendations as they pertain to math education.
Data literacy in K-12 schools
In recent years, there has been a push for students to identify reliable information and data as evidenced by published standards. Whether it is primary and secondary sources in social studies, distinguishing fact from opinion in language arts, or questioning the reliability of data in science, it has become commonplace for students to question the source of information and ascertain whether or not that source is reliable. The next step to improving data literacy is to strengthen the necessary math skills including using statistics, reading graphs, and understanding ratios and proportions.
This past summer, Virginia approved a high school data science course and added more data analysis to the K-12 math standards. California also added high school data science as part of a sweeping change to their mathematics standards. With calls from leading math education experts to address data in mathematics, it is likely that other states will add data-focused mathematics standards. This means that while adults and current college students may lack some data literacy skills, future students may be more proficient.
Data literacy in the college math classroom
As the article for this blog indicates, it is likely that we have college students who are not adept at data analysis. In particular, they may be challenged by ratios and proportional reasoning and with interpreting graphs to glean relevant information. These concepts could be addressed in multiple college math courses.
If you teach statistics, how to address these necessary concepts is obvious. While your students may be able to determine means and range and identify outliers, they may be challenged to view graphs holistically and identify patterns. Viewing scatterplots may help students see trends, deciding whether and what type of relationship may exist between variables before attempting an analysis. Students may also be challenged to determine appropriate sample sizes given a population, addressing ratios and proportions. Allowing students to grapple with these questions, in context, can strengthen data literacy skills.
In algebra and other math classes, we often use ideal data that can make an ideal graph so students can easily identify the relationship between function and graph. Once students are comfortable, they need to grapple with real-world, messy data, where the interpretations are not entirely clear. We can encourage students to look for patterns made by the data and decide what function may best fit. Students can also create different representations from data tables to identify trends and to tell a story with the data.
If we want our students to improve their data analysis skills, we need to allow them to engage in productive struggle with data. There needs to be a balance between explicit instruction where students learn basic concepts and procedures, and discovery learning where students may be able to develop “epistemic awareness, critical literacies, and discursive capabilities.” If we allow our students to spend time grappling with data, they may eventually become data literate.
Bottom line:
- Many adults do not consider data when making decisions and struggle with data literacy skills.
- Current K-12 teaching focuses on identifying accuracy of information, but other data literacy skills need to be developed.
- New state standards ensure that data literacy skills, including numeracy and data visualization are specifically taught in math and not just in science.
- Our college math students are likely lacking in data analysis skills and we need to engage them in productive struggle to develop these skills.